Sensorium Data Centre Infrastructure Management Platform
Looking for a Powerful, Flexible, Cost-Effective DCIM Solution?
You've Just Found it!
Meet Sensorium DCIM, your next-generation Data Centre Infrastructure Management platform, designed to scale from small comms rooms to mega data centres.
Learn more about DCIM by reading our Ultimate Guide to Data Centre Infrastructure Management (DCIM). Alternatively, watch our short introductory video on Sensorium.
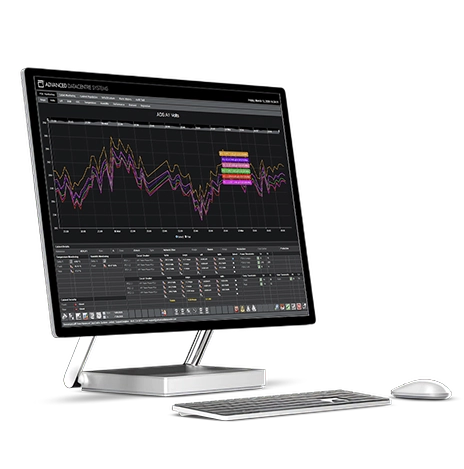
Sensorium DCIM delivers results through these core features:
- Grow Without Limits: A modular 64-bit architecture handles scale and is ready for virtualisation.
- Connect Everything: Integrate easily with legacy data centre hardware thanks to a flexible communication structure.
- Access Anywhere: Use custom dashboards in a modern, web-based interface.
- Instant Clarity: Get real-time cabinet data, trend graphs, and instant alarm alerts.
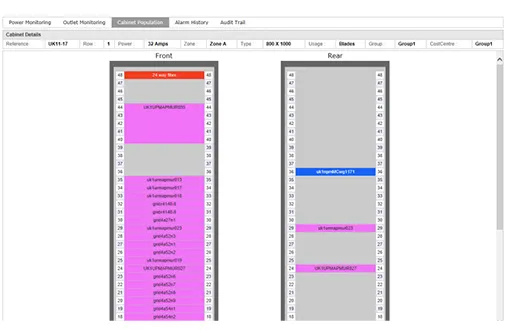
- Optimise Capacity: Manage assets, track cabinet population, and generate benchmark reports.
- Link to Building Systems: Easily connect to your existing BMS and third-party systems, regardless of the vendor.
- Simple Navigation: Interactive floor plans, drill-down views, and linked digital manuals guide every user.
Bespoke Dashboards & Home Screens
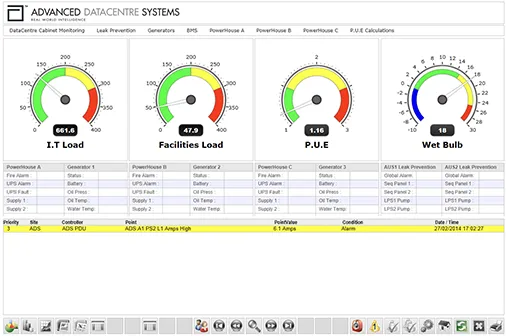
Sensorium DCIM helps you build personalised dashboards and home screens that truly fit your teams, offering both power and affordability:
- Create custom dashboards and home screens for individual teams or specific roles, making tailored solutions genuinely affordable for the first time.
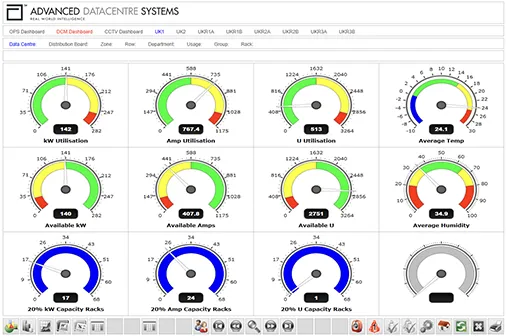
- Tailor the user interface for each group, whether your OPS team needs a graphical floor plan or your Data Centre Managers prefer data grids and dashboards.
- We use standard, trusted web technologies like HTML, ASP, CSS, and JavaScript. This means you can modify Sensorium’s templates easily with common web authoring tools, creating custom solutions at a budget-friendly price.
Dynamic Icon Floor Plans
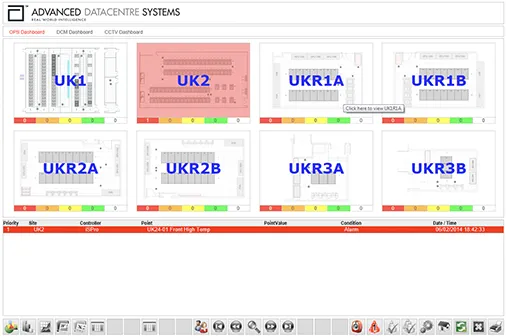
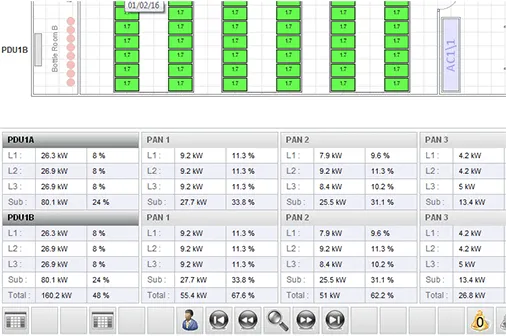
Gain instant insight into your data centre’s health with our interactive floor plan.
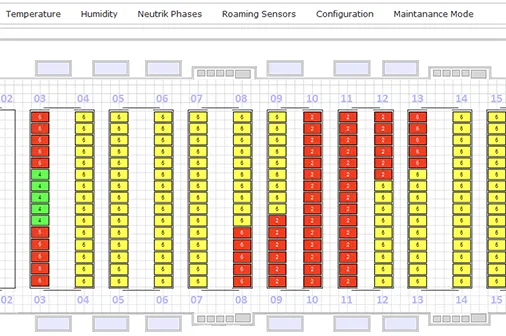
- Visual Status: Dynamic icons on the floor plan show the exact location, operational state, and alarm status of every data centre cabinet.
- Colour-Coded Alerts: A traffic light system (Red, Amber, Green) immediately signals if key metrics exceed customer-defined limits.
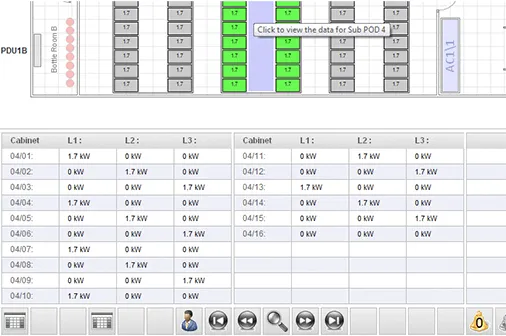
- Detailed Data: A data grid below the floor plan presents additional performance metrics like phase loadings, PUE, and DCIM information.
- Drill-Down Capability: Click specially designed hyperlinks on the floor plan to reveal more detailed, real-time, and historical data for any selected cabinet, row, zone, or main distribution unit.
Real-time & Historical Cabinet Data
The Sensorium™ web component simplifies infrastructure management by delivering a single, unified overview of your cabinet’s performance while providing instant, powerful control.
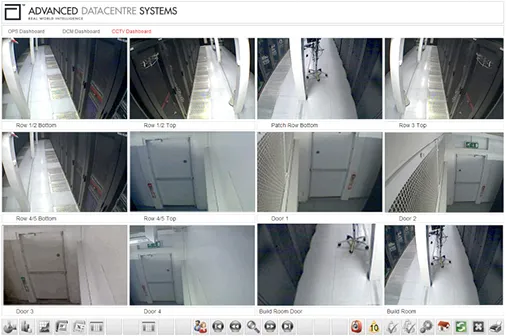
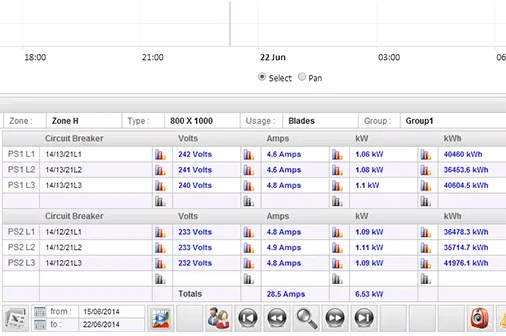
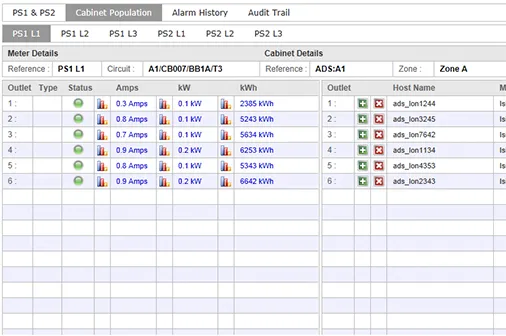
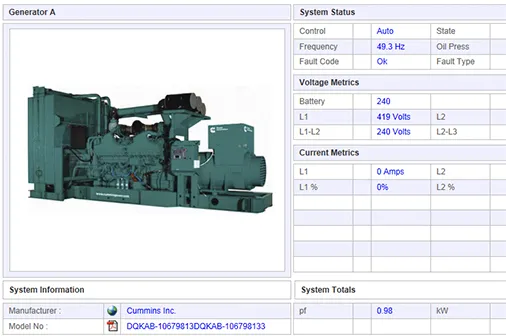
- View Consolidated Data: See real-time information from all sources—including PDUs, temperature sensors, humidity meters, access controls, and CCTV.
- Ignore Protocol Barriers: The system automatically harmonises varying protocols and data formats, successfully gathering information that traditional tools cannot unify.
- Adjust Controls Instantly: Easily adjust hardware thresholds and set points directly from the unified interface.
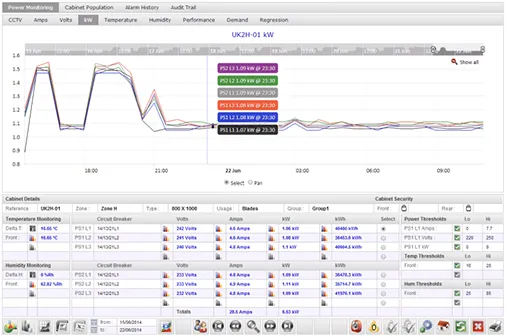
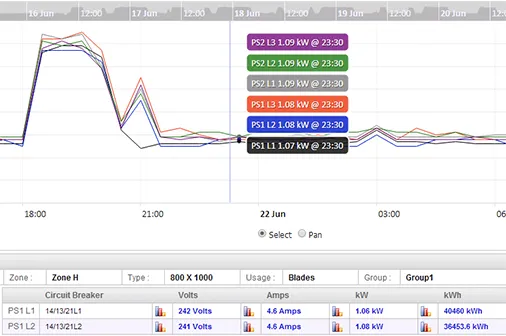
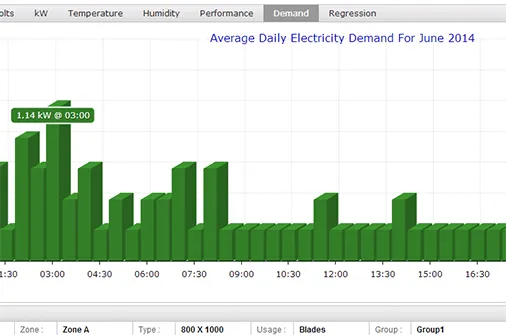
- Analyse Performance History: Utilise the historical data logging component to visualise past performance trends through detailed 3D graphs, clear data grids, and simple gauges.
Asset Register & Cabinet Population
Sensorium™ transforms how you manage your data centre, linking detailed asset registers directly to provide unparalleled operational insight:
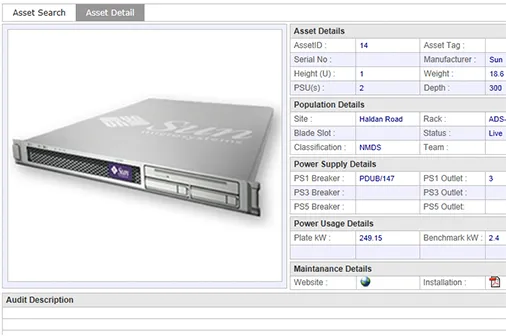
- Connect asset and cabinet population data directly with real-time and historical power usage logs to deliver comprehensive metrics.
- Easily integrate the Sensorium™ asset database with external, third-party data sources, adding powerful functionality to your company’s existing asset register solution.
- Benchmarking and granular performance reports — ideal for energy usage or billing.
Building Services Integration
Sensorium™ delivers a DCIM that seamlessly integrates every part of your building’s services, from modern to legacy systems, into a single, easy-to-use platform.
- Connect Any System: Our vendor-neutral server speaks multiple communication protocols and has a proven 20+ year track record of successful integration.
- Ensure Reliable Connections: We have established partnerships with leading interface manufacturers to guarantee the highest level of communication, even for older equipment.
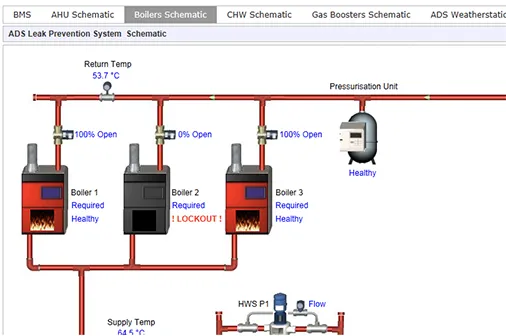
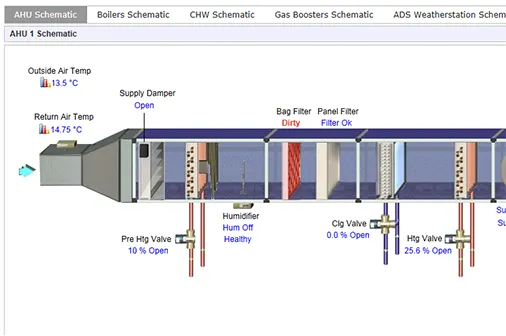
- View Data Your Way: Display information in any format you need, from a simple data list to interactive 3D schematics.
- Centralised Information: Access user manuals, configuration guides, and maintenance documents directly through the platform, making them easy to find for your entire team.
Proven Results: A Closer Look
Discover how Sensorium DCIM has helped our clients by reading our case studies:
- Bridging the Legacy Gap in a UAE Data Centre – The UAE colocation provider unlocked power visibility across legacy systems. It avoided expensive hardware replacements. Thus, it built a scalable platform for future upgrades.
- Breaking Vendor Lock-In for a European Bank – A European bank switched PDU vendors smoothly. Consequently, it maintained unified monitoring and centralised rack access. Therefore, it eliminated operational complexity.
How Sensorium™ DCIM Works
Sensorium™ is a Data Centre Infrastructure Management platform that actively gathers essential data from all monitored devices (PDUs, UPS, sensors, and BMS).
- A central server instantly cleans and consolidates this information.
- Web components then display clear dashboards, floor plans, and critical alerts.
- Users control the system directly via the web interface, using it to set performance limits and customise warnings. Furthermore, historical logging saves all data, enabling easy trend analysis and report generation.
DCIM vs BMS: Why Sensorium™ is the Smart Choice
Sensorium™ isn’t just a DCIM tool — it’s a comprehensive, integrated management platform designed for data centres that demand performance, flexibility, and ease-of-use. It delivers:
- Cost Efficiency — customisable without enterprise-level spend.
- Long-term Value — built on a scalable and flexible architecture.
- Operational Transparency — real-time and historical insights across infrastructure.
- Integration Depth — integrates well with both modern and legacy systems.
- User-focused Design — dashboards for different roles, intuitive navigation
- Single Management Platform – Sensorium is a vendor-neutral platform that combines DCIM, BMS, and PMS tools into one system to help you meet your goals and stay compliant.
Get in touch today
Ready to bring Sensorium DCIM to your data centre? Drop us an email at info@advanceddatacentre.com or contact us. Let’s talk through your needs — and how Sensorium™ can deliver.


